AI Readiness Index (AIR) Rankings – Retail
PRODUCT OVERVIEW
Which retailers are ranked highest in Retail AI Readiness to take advantage of this both old and emerging technology?
Who has their data in order, who has the scale and talent to fully take advantage of this transformational technology?
How do companies rank by $$$ impact and readiness?
This is what the IHL AI Readiness Index (AIR) Rankings – Retail is all about. We rank North American publicly traded retailers by their position and potential impact of AI/ML and Generative AI. We include impact by increased sales, improved gross margins, and improvements in sales and general administrative expenses. The retail labor shortage is not going away anytime soon. The retailers that can leverage automation, and AI specifically on operational issues will be the winners of the next decade.
Rankings available for the following: Top overall, FMCG (Fast Moving Consumer Goods), Apparel, Hard Goods, Health and Beauty, Restaurants, Ecommerce and total list. See below for the outline and About the Index tab for detail on how we went about the rankings.
Read IHL’s Overall Retail AI Forecast for Free
While the AI Readiness Index (AIR) Rankings – Retailis a look at North American public retailers, this research paper goes through a summary the entire market worldwide by segment and quantifies the financial impact by segment and tier that AI, Generative AI, and Artificial General Intelligence will have through 2029.
Detailed Worldwide Forecast of Impact through 2029.
This detailed forecast is for those companies that need to understand what the opportunity for AI impact is by solution area. So, if you want to know the impact AI will have on store systems, or pricing, this product is for you.
HIGHLIGHTS
Note: Due to lack of visibility and breakout of retail sales, communications companies such as Apple, Samsung, Verizon, AT&T, T-Mobile as well as Fuel/Convenience Stores (Exxon, Valero, etc.) are excluded from this index. Full list of rankings is at the bottom of the page.
Table of Contents
Definition of Segments
Overview of the Index
Rankings
Overall
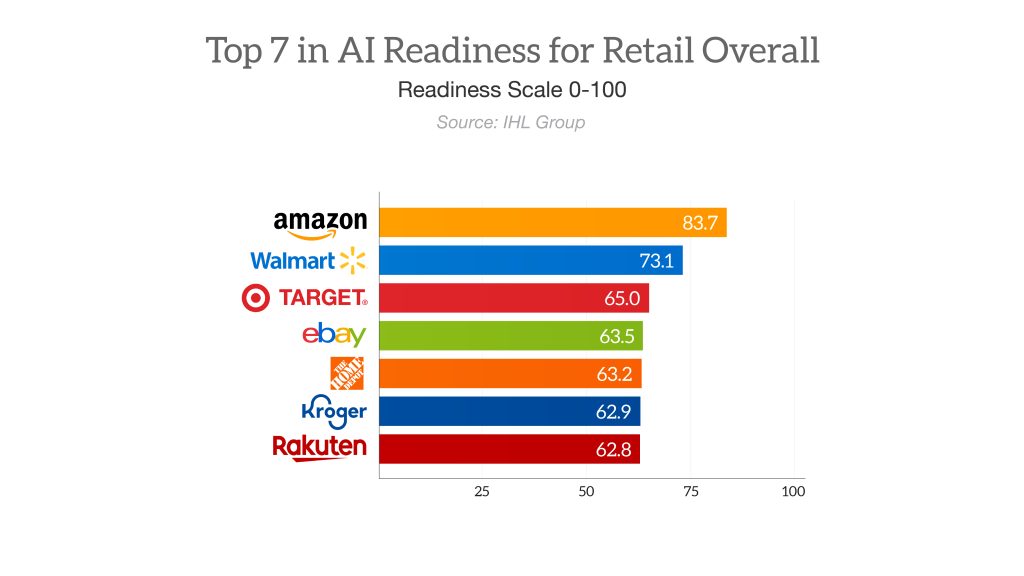
Top 7 Retailers Overall by AI Readiness
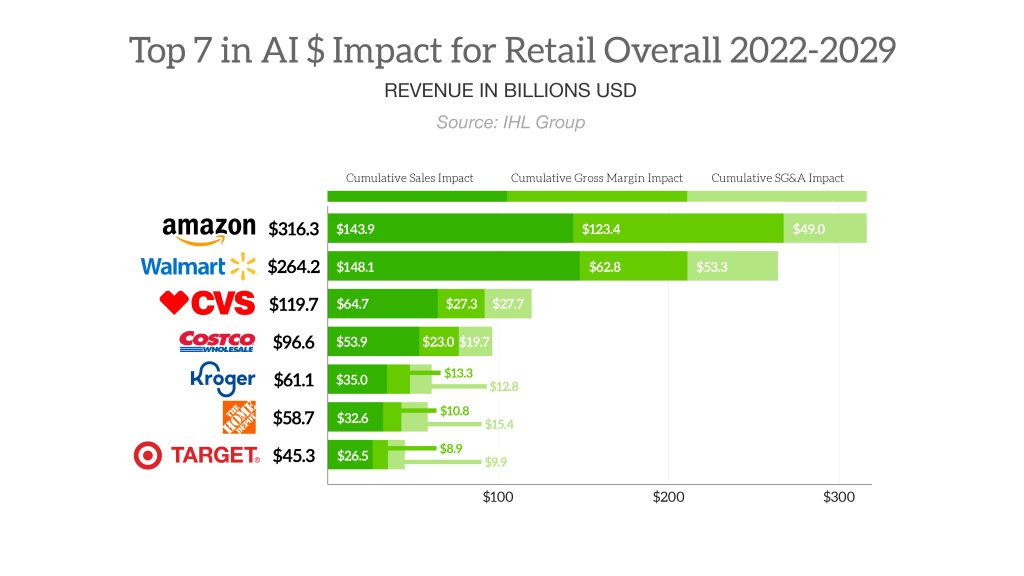
Top 7 Retailers Overall by Financial Impact of AI 2022-2029
Fast Moving Consumer Goods (FMCG)
Top 7 Fast Moving Consumer Goods AI Readiness (Grocery, Mass Merchants, Warehouse Clubs)
Top 7 Fast Moving Consumer Goods by Financial Impact of AI 2022-2029
Apparel
Top 7 Apparel Retailers by AI Readiness (Apparel, Shoes, Luggage)
Top 7 Apparel Retailers by Financial Impact of AI 2022-2029
Hard Goods
Top 7 Hard Goods Retailers by AI Readiness (DIY, Electronics, Books, Furniture, Pets, Sporting Goods, etc.)
Top 7 Hard Goods Retailers by Financial Impact of AI 2022-2029
Health and Beauty
Top 7 Health and Beauty Retailers by AI Readiness (Drug Stores, Cosmetics)
Top 7 Health and Beauty Retailers by Financial Impact of AI 2022-2029
Restaurants
Top 7 Restaurant Chains by AI Readiness (Fast Food, Bar/Table Service)
Top 7 Restaurant Chains by Financial Impact of AI 2022-2029
Pure Play Ecommerce
Top 7 Ecommerce Retailers by AI Readiness (All segments for online only or mostly online retailers)
Top 7 Ecommerce Retailers by Financial Impact of AI 2022-2029
All 215 Retailers in the Index
List includes current revenues, AI Readiness score, total financial impact forecast 2022-2029
Breakdown of impact by Sales Growth, Gross Margin Improvement, SG&A Improvement
Join the waitlist and be the first to know when released
Companies included with Retail AI Readiness scores and AI Impact 2022-2029 include the following:
AMCON Distributing Company, ARAMARK, Aaron’s, Abercrombie & Fitch, Advance Auto Parts, Albertsons Companies, Allbirds, Amazon.com, American Eagle Outfitters, Ark Restaurants Corporation, Asbury Automotive Group, AutoZone, B & G Food Enterprises, BAB, Inc. [Big Apple Bagels], BJ’s Restaurants, BJ’s Wholesale Club, BMC Select, Barnes & Noble Education, Bath & Body Works, Beacon Roofing Supply, Best Buy, Big 5 Sporting Goods, Big Lots, Biglari Holdings, Blue Apron, Boot Barn, Boston Pizza International, Brilliant Earth, Brinker International, Build-A-Bear Workshop, Burlington Coat Factory, CDW Corp., CVS Health, Caleres, Camping World Holdings, Canada Goose, Canadian Tire Corp., Carrols Restaurant Group, Carter’s, Cheesecake Factory, Chewy.com, Chico’s FAS, Chipotle Mexican Grill, Chuy’s, Inc., Citi Trends, Columbia Sportswear Company, Conn’s Inc., Costco Wholesale Corporation, Cracker Barrel Old Country Store, Crocs, Inc., Darden Restaurants, Dave & Buster’s, Denny’s Corporation, Designer Brands, Destination XL Group, Dick’s Sporting Goods, Dillard’s, Dine Brands Global, Dollar General Corporation, Dollar Tree, Dollarama, Domino’s Pizza, Duluth Trading Company, Dutch Bros Coffee, Ebay, El Pollo Loco, Estee Lauder, Ethan Allen Interiors, Etsy, Express, Family Fare Supermarkets, Fastenal, Fat Brands, Ferguson Enterprises, Fiesta Restaurant Group, Finning, FirstCash, Five Below, Flanigan’s Enterprises, Floor And Decor Outlets Of America, Foot Locker, Fossil, Franklin Planner Corp, Gaiam Inc., GameStop-US, Gap, Inc., Genesco, Genuine Parts Company/NAPA, GoPro Inc, Good Times Restaurants, Grocery Outlet, Group 1 Automotive, Groupon Inc., Guess, Inc., Harley-Davidson, Havertys Furniture Companies, Hibbett Sports, Hugo Boss, Indigo Books & Music, Ingles Markets, Jack in the Box, Jo-Ann Stores, Kirkland’s, Kohl’s, Kura Sushi USA, LL Flooring, La-Z-Boy, Lands’ End, Leon’s Furniture, Limited, Lindt & Sprungli USA, Liquor Stores NA, Loblaw Companies Ltd., Lowe’s Home Improvement Cos., Lululemon Athletica, Lumen [CenturyLink], MTY Food Group, Macy’s, MarineMax, McDonald’s Corporation, Meritage Hospitality Group, Metro, Inc.-Canada, Miniso, Monro Muffler Brake, Movado Group, Muscle Maker Grill, Nathan’s Famous, National Pen, Natural Grocers, Nike, Noodles & Company, Nordstrom, O’Reilly Automotive, Odd Burger, Office Depot, Ollie’s Bargain Outlet, Option Care Health, Overstock.com, PANDORA A/S, PC Connection, Papa John’s International, Pfaltzgraff, Pier 1 Imports, Pittsburgh Paints-PPG, PriceSmart, Qurate Retail Group, Rakuten.com, Ralph Lauren, Rave Restaurant Group, Red Robin Gourmet Burgers, Reitmans(Canada), Rent The Runway, Restaurant Brands International, Restoration Hardware, Richelieu Hardware Ltd., Rite Aid Corporation, Rocky Mountain Chocolate Factory, Inc., Roots Canada, LTD, Ross Stores, Inc., Sally Beauty Holdings, Inc., Scholastic Inc., Shake Shack, Sherwin-Williams, Shoe Carnival, Inc., ShopHQ, Skechers U.S.A., Inc., Sleep Number Corporation, Sonos, SpartanNash Company, Sportsman’s Warehouse, Sprouts Farmers Market, LLC, Starbucks Coffee Co., Steve Madden, Stitch Fix, Sweetgreen, Systemax, T.J. Maxx, Tanger Outlets, Tapestry, Inc., Target Corporation, Texas Roadhouse, The Buckle, The Cato Corporation, The Children’s Place, The Home Depot, The J. Jill Group, The Kroger Co., The North West Company, The One Group, The Walking Company Holdings, ThredUP, Tilly’s, Torrid, Tractor Supply Co., Ulta Beauty, Urban Outfitters, Vera Bradley, Victoria’s Secret Stores, Village Super Market[Shoprite], Vince, Walgreens Boots Alliance, Walmart Stores, Warby Parker, Wayfair.com, Weis Markets, Wendy’s International, Williams-Sonoma, Wolverine World Wide, YETI Coolers, Yum! Brands, Zumiez, e.l.f. Beauty, easyhome ltd.
PREVIEW


ABOUT THE INDEX
The AI Readiness Index was created from numerous public and private resources from IHL’s research.
1. Overall AI Forecast
We started by creating a forecast for AI Impact for worldwide retail, forecasting that impact from 2022-2029 worldwide, segment, and tier. We used the standard financial statement for our basis. We started with a standard forecast for retail sales for the next 7 years and then we added potential AI impact. For instance, forecast AI impact in 3 buckets: Sales Growth, Cost of Goods improvement and Sales/General Administrative (SG&A) improvements that AI could provide. From that, we then looked at those impacts by year in 3 categories of AI. The traditional AI/ML, Generative AI, and Artificial General Intelligence later in the decade. More detail can be found here on our overall forecast.
2. AI Impact by Line of Business Function and Solution Area
We then used our Worldview IT 10 Line of Business categories (Business Intelligence, Commerce, Sales & Marketing, Distribution and Supply Chain, etc) to segment the total impact for each area by each of the AI types. Further, we used solution types as a way of even further defining business impact…what do retailers do with these solutions – what impact do these make in an organization? Some are more impacted than others and our total forecast is impacted by that.
3. IHL Sophia for companies
In our Sophia intelligent lead service, we track the hardware, software, services and key personnel. What we show publicly is the publicly available data for each company. But we have a great deal more NDA data for installs by retailers and vendors due to our analyst reports. Although we have many thousands of retailers in the database, we limited this first index to public retailers based in North America. The reason for this is accurate financials for sales, sales growth and profit is critical to the index we created. Those most ready to take advantage are not just those that have their systems in order but are in the financial shape to make the investments required to truly scale this technology.
4. The AI Readiness Index
Once steps 1 and 2 were created we had the parameters to work from that would allow us to evaluate individual retailers against each other. We then created a 9-part algorithm for evaluation and ranking. This algorithm included total revenue (scale matters in AI), data maturity, analytics maturity, alignment with AI leaders and key vendors, retail segment (segment has big impact on AI due to availability of clean data and scale), cloud score (how much do they leverage cloud for data lakes – whether public or private), sales growth $, and profit growth $ (free cash flow and profitability matters).
5. The end result
The end result is each retailer receives a score from 0-100 and we have the financial impact forecast for each retailer. That is what included in this study. We are also planning to add the entire detailed forecast by line of business category for each retailer in our Sophia system going forward. So, if you are interested in our view of what AI will bring for impact to Walmart’s merchandising and supply chain systems, we will have a forecast for that.
PRICING
License Options
Enterprise License – a license that allows for the research to be accessed and shared internally with anyone else within the organization and wholly owned subsidiaries. This cannot be shared outside of your organization without purchasing a Distribution license.
Distribution License – a license that allows the purchasing organization to distribute the report to investors, clients, and others for the purpose of lead generation or due diligence.
IHL Group License and Fair Use Agreement
All of IHL Group’s generally available research are electronic licenses and are limited by the license type chosen for purchase. For Single User Licenses this means that the person buying the research is the only person to use the research.
For Enterprise Licenses, these can be shared freely within the company. We only ask that this information not be shared with partners or others outside the purchasing company without authorization from IHL Group. The license does not extend to joint ventures or other partnerships. If the relationship is not a wholly-owned subsidiary, then both parties would need a license.
Practically, this implies the following:
- The purchasing company can use the data and research worldwide internally as long as the international organizations are wholly owned subsidiaries of the purchasing company.
- The data or any research cannot be distributed in whole or in part to partners or customers without express written approval from IHL Group.
- The purchasing company may quote components of the data (limited use) in presentations to customers such as specific charts. This is limited to percentage components, not individual unit information. Unit data cannot be shared externally without express written approval from IHL Group. All references to the data in presentations should include credit to IHL Group for the data.
- The purchasing company can reference qualitative quotes in printed material with written approval from IHL Group.
- All requests requiring written approval should be submitted to ihl(at)ihlservices.com and will be reviewed within one business day.
For Distributed Licenses, if applicable, the research can be shared with prospective customers and potential institutional investors. It cannot be shared with partners or other vendors who should be purchasing their own licenses.
For any questions regarding this policy, please contact us at 1-888-IHL-6777 (North America) +1.615.591.2955 (International) or email us at ihl(at)ihlservices.com.