Winning the Race of Innovation: How Top Performing Retailers are Investing in Technology
PRODUCT OVERVIEW
Who is winning the race of innovation in Retail?
This report highlights which retailers are winning the race of innovation. Discover which types of retailers are investing at a higher rate than others, and what are they planning to buy in 2024? What technologies have the best performing retailers already been investing in and seeing results? How does AI come into the equation. These are just some of the questions answered in this new research from IHL Group
There are clear differences among profit leaders on the technologies behind the scenes that are continuing to improve their margins and offset the impacts of inflation. Some of the key technologies included are POS hardware and software, self-checkouts, payments, mobile POS, Edge Computing, RFID, Computer vision, Artificial Intelligence, 5g, Microservices, Data Lakes, Electronic Shelf-Labels and other Digital Displays, Frictionless technologies, facial recognition, geolocation and others.
In “Winning the Race of Innovation” we look at AI impact of 10 technologies including Forecasting, Order Management, Order Fulfillment, Supply Chain/WHS Management, Merchandise Allocation, Pricing/Promotions, BI/Analytics, Loss Prevention, Sales & Mktg, HR/WFM/App Dev/Customer Service and others.
With responses from over 269 top retail brands, we have produced the results in a detailed, but very easy to read study. You also get the raw data to do your own analysis by segment.
The report is designed for use by Retailers, Hardware Providers, Software Providers, Service Providers, Investors, Property Managers and others who might have a vested interest in the North American retail market. The complete outline with chart titles is below.
HIGHLIGHTS
Key Highlights
Along with research study analysis your license also includes the raw data in spreadsheet form to do your own cross tabs. You can cross tab any answer to any other answer for unique insight.
We break down the data to find answers to questions that many in our industry are asking, like the following:
What do the IT Spend, Store Growth and Store Remodels look like for 2023?
How does AI impact technologies?
What are the retailers’ Top System Priorities?
What does 2023 look like for POS, Software, Emerging Technologies? What are the trends driving change?
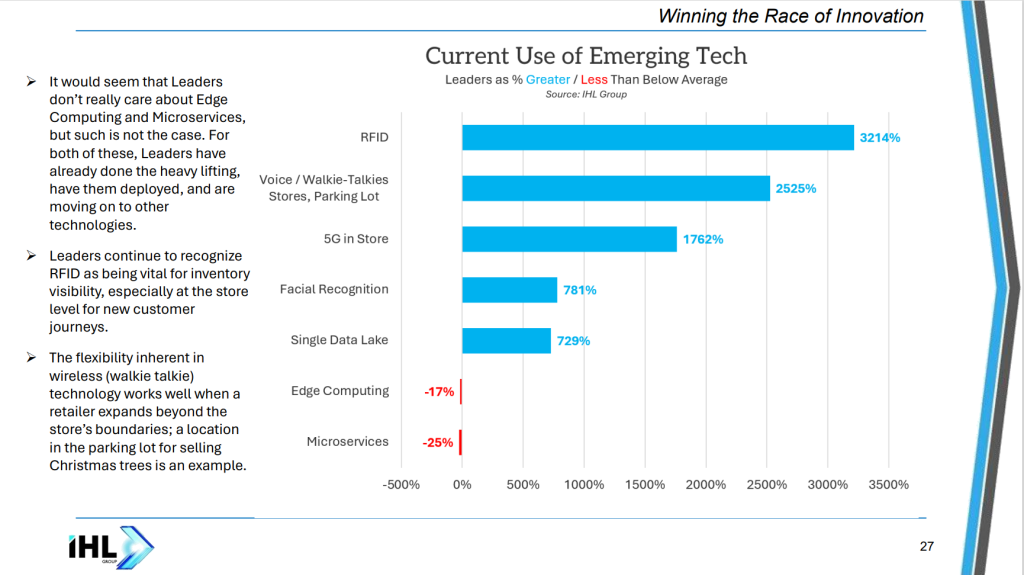
How fast is Edge Computing, RFID, Computer vision or Microservices growing?
What digital customer journeys are profitable for retailers and which are optimized? What is the value of optimizing these journeys.
Which segments are looking to replace POS clients or POS Software? Will it be a good year for Contactless Payments?
Who is planning to deploy which Mobile Platforms, and when?
Table of Contents
Introduction
Study Highlights
Growth Data
Stores & Remodels
IT Spend
Retail Sales Expectations
Digital Customer Journeys
Sales Change by Journey
Sales as % of Total
Overall % of Sales that has a Store Component
Retailer Priorities for 2024
Traditional Technologies and Purchase Plans
Emerging Technologies and Purchase Plans
Spend for Innovation of Existing Systems
AI Impact – Major Impacts in Sales Improvements and Expectations
Appendix and Methodology
PREVIEW
Click on a thumbnail to expand.
FAQS
Is this a comprehensive view of the marketplace?
No, this is a survey of more than 269 brands with stores in all retail segments and their purchase intentions. While a full market overview would include everyone, this is just the answers of those that responded to the survey. Caution should be used in extrapolating these results to the entire market. For some comprehensive market research on store automation technologies, you should Click Here.
Did this survey cover larger or smaller retailers?
Actually both. Roughly 45% of the respondents were retailers over $1 Billion. Another 10% were retailers over $500 Million but less than $1 Billion. The remaining retailers were under $500 Million in annual sales. The data is broken down by retailer size so you can see the differences.
Can I share this study in my company?
Yes if you have an enterprise license. See below for more.
Can I share this study with partners and clients?
Not in entirety unless you have negotiated a distribution license with IHL. Basically we don’t want the study going to partners and clients who should otherwise purchase a license. This is what we do for a living, and if people violate this we can no longer do the research. Contact us at ihl(at)ihlservices.com with any questions.
Can I quote this study in my presentations and press releases?
This is fine in most cases, but we ask that you run it by us first at ihl(at)ihlservices.com. Typically sharing percentages (ie. this is a 20% increase) is fine, but sharing raw $$$ or units is not. We realize that you buy the research to use, so we can usually find a nice compromise that meets your needs while protecting our IP. We can work with you.
Can I get access to the analysts who wrote or partnered in the study?
Yes, one of the core differentiators of IHL Research Studies is that included in part of the price is up to 1 hour with the analyst to ask follow-up questions or dig further into any assumptions. This does not extend to getting more data, just better insight into how we arrived at the data and came to the conclusions from that data.
PRICING
License Options
Enterprise License – a license that allows for the research to be accessed and shared internally with anyone else within the organization and wholly owned subsidiaries.
IHL Group License and Fair Use Agreement
All of IHL Group’s generally available research are electronic licenses and are limited by the license type chosen for purchase. For Single User Licenses this means that the person buying the research is the only person to use the research.
For Enterprise Licenses, these can be shared freely within the company. We only ask that this information not be shared with partners or others outside the purchasing company without authorization from IHL Group. The license does not extend to joint ventures or other partnerships. If the relationship is not a wholly-owned subsidiary, then both parties would need a license.
Practically, this implies the following:
- The purchasing company can use the data and research worldwide internally as long as the international organizations are wholly owned subsidiaries of the purchasing company.
- The data or any research cannot be distributed in whole or in part to partners or customers without express written approval from IHL Group.
- The purchasing company may quote components of the data (limited use) in presentations to customers such as specific charts. This is limited to percentage components, not individual unit information. Unit data cannot be shared externally without express written approval from IHL Group. All references to the data in presentations should include credit to IHL Group for the data.
- The purchasing company can reference qualitative quotes in printed material with written approval from IHL Group.
- All requests requiring written approval should be submitted to ihl(at)ihlservices.com and will be reviewed within one business day.
For Distributed Licenses, if applicable, the research can be shared with prospective customers and potential institutional investors. It cannot be shared with partners or other vendors who should be purchasing their own licenses.
For any questions regarding this policy, please contact us at 1-888-IHL-6777 (North America) +1.615.591.2955 (International) or email us at ihl(at)ihlservices.com.