Latin / South America (LATAM) mPOS (Mobile POS) Market Share – 2024
This research looks specifically at Latin / South America mPOS Market Share and those mobile devices being used for POS functions.
PRODUCT OVERVIEW
The move to mobile POS (mPOS) for associates is the single fastest adopting trend we have seen since the rush to get stores Internet-enabled. In our Latin / South America mPOS Market Share study we look specifically at those mobile devices being used for POS functions. How big is this market? How fast is it growing? Which vendors are winning? What screen format should you write the software for? This research will tell you.
This study on Latin / South America mPOS Market Share provides shipments and installed base on a quarterly and annual basis for vendors such as Apple, Zebra, Samsung, HP, Lenovo, Dell, HTC, Motion Computing, NEC and many others for use of mobile devices for POS, an area that is exploding in retail. It includes data on screen size formats and operating platforms. We distinguish between retail hardened devices and consumer grade devices. This is a very data intensive product and can go as deep as shipments by segment by region by operating system or screen size. Or the data can be purchased simply in aggregate by vendor worldwide/region. It includes historical data and projections forward for the next 6 quarters by vendor.
The sizing includes research that is inclusive in retail store locations and chains as well as what is installed for the mPOS with data from the following countries:
- Mexico
- Brazil
- Colombia
- Chile
- Argentina
- Peru
- Venezuela
- Other Latin / South America
Below in the Product Highlights section we get into the details of the data available in this Mobile POS (mPOS) Market Share study. The Preview tab gives you some pictorial examples of the types of data available.
This is very data intensive research and can go as deep as shipments by segment by region by operating system or processor-type. The data can also be purchased simply in aggregate by vendor worldwide or by individual region. Included are historical data back 2 years and projections forward for the next 6 quarters by vendor.
This data is meant to be used in conjunction with the Mobile POS Study which provides the qualitative background of the trends. It is in this study where we discuss trends, barriers to entry, and growth assumptions. The data here is purely quantitative in nature. We are thankful to the vendors who participate in sharing data points to make this as accurate as possible. This data is tracked quarterly.
Related Studies
Related studies include:
- North America Restaurant Chain Sizing with POS/mPOS – 2024
- North America (mPOS) Mobile POS Market Share – Hardware – 2024
- Europe/Middle East/Africa (EMEA) mPOS (Mobile POS) Market Share – Hardware – 2024
- Asia/Pacific (Mobile POS) Market Share – Hardware – 2024
- Latin/South America (LATAM) POS Terminal Study – 2024
- Latin/South America (LATAM) Point-of-Sale (POS) Market Share – Hardware – 2024
- Latin/South America Retail Store Location Chain Sizing with POS/mPOS – 2024
HIGHLIGHTS
For each segment we provide data for the top 10-20 vendors per the following retail segments:
- Food/Grocery (Kroger, Safeway, Trader Joe’s, Wakerfern, Tesco,)
- Drug Stores (Walgreens, CVS)
- Superstore/Warehouse Clubs/Hypermarkets (Walmart, BJ’s Wholesale, Costco, Auchan)
- Mass Merchants (Target, Meijer Stores)
- Department Stores (JC Penney, Sears, Kohls, Kaufaf, Marks and Spencer)
- Specialty Hard Goods (Home Depot, Lowes, Best Buy, Rooms to Go, Canadian Tire)
- Specialty Soft Goods (H&M, Abercrombie, Zara)
- Convenience/Gas/Forecourt (Chevron, Exxon,)
- Hospitality
For each region, we will provide the following detail either annually or quarterly:
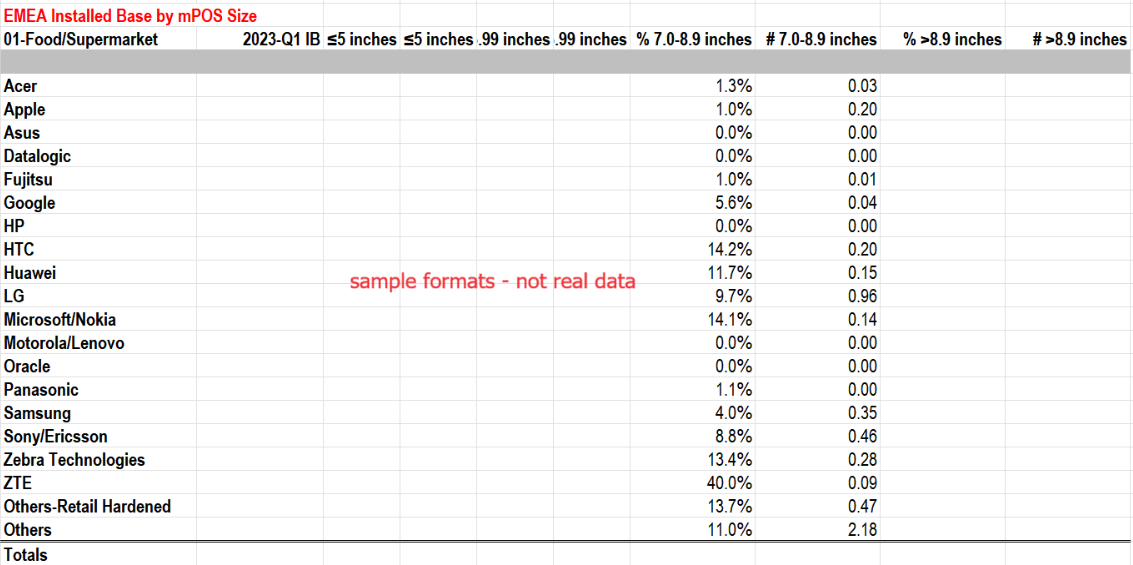
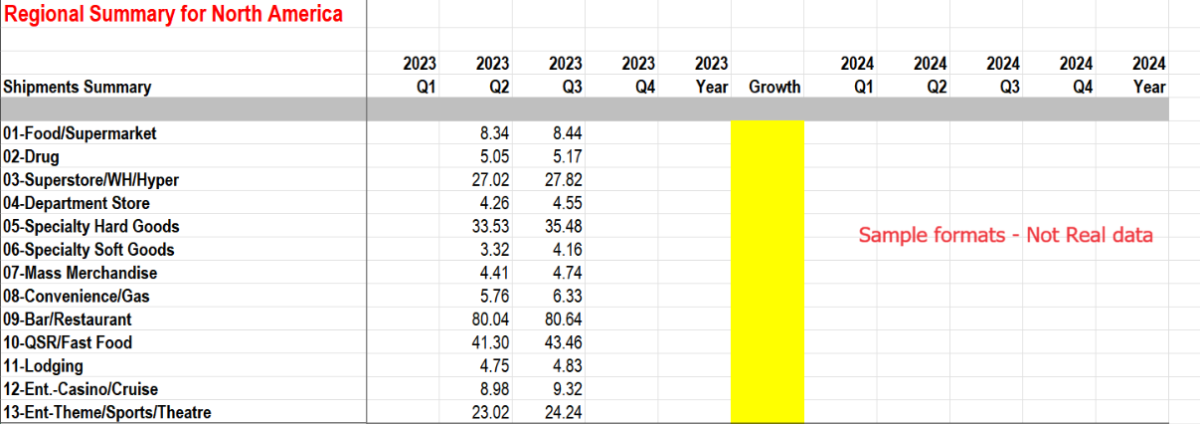
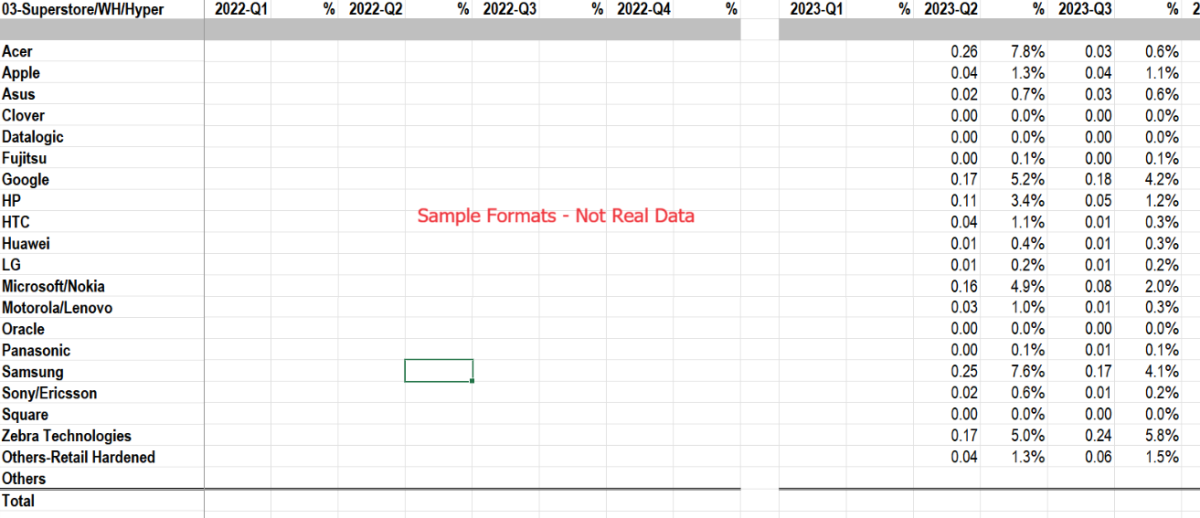
Total Shipments and Installed Base by Device Format – this is a rollup by segment and by vendor and will include the previous year, then forecast for next 6 quarters. Includes shipments and installed base. This will be a very detailed sheet and will include the following Device Sizes:
8.9″
Regional OS Shipments/Installed Base by Vendor – This is the same format as Device Format/Size, but instead of the processors we will look at the operating systems by vendor by segment. The following operating systems are addressed.
Android iOS Windows 8/10 Windows CE/Mobile/Phone Windows Other Other
Vendors that will be tracked in this research by name are the following:
- Apple
- Datalogic
- HP
- LG
- Microsoft
- Motorola/Lenovo
- Nokia
- Oracle
- Samsung
- Sony/Ericsson
- Zebra Technologies
- Others-Retail Hardened
- Others
Types of devices included will be inclusive of iPhones, iPads, iPods, Kindles, and tablets. We will not name the names of each, but by combining vendor and form factor it will be inclusive of those devices based on screen size.
This data is reviewed for Retail Hardened and Consumer Grade Devices. Contact us at ihl(at)ihlservices.com for more information.
PREVIEW
Below are some examples of some screen shots. These have sample data showing formats from older years…the data is updated to current year and quarters for last 8 quarters. Please contact us for a demo of current data
We welcome you to contact us for a demo of the product so you can see the level of current data and detail you would be provided.
Click Thumbnails to See More
FAQs
What do you define as Mobile POS?
There are no doubt many mobile devices ranging from phones to phablets to tablets of all sizes. This specific service is for those devices being used by associates to process a transaction. This can be with or without credit/debit readers, or it could be a consumer grade device or retail hardened. If it is purposed as a way to take transactions, we count it. To be clear, this is limited to the traditional retail segments as defined. We are not counting charities, repairmen, delivery men or garage sales where individuals add a dongle and swipe a credit card. For non-traditional retail for transactions, or mobile device information beyond POS, contact us for more information.
What retail market segments (verticals) do you address?
Our format for the study is based on detailed analysis of the following 8 retail market segments:
- Food/Supermarkets
- Drug Stores
- Hypermarkets/Superstores/Warehouse Clubs
- Department Stores
- Specialty Stores
- Mass Merchandisers (includes Discount Stores)
- Convenience Stores/Gas Stations
- Hospitality (Restaurants, Lodging and Entertainment)
For North America we further segment Specialty Stores into Specialty Category Killers and Specialty Other, and Hospitality into Fast Food, Bar/Restaurant, Lodging, Casinos/Cruises, and Entertainment: Theme Parks, Stadiums, Museums, others.
How do you define the sizes/formats involved included?
No doubt this is a fluid category. We looked to our core customers to help define the sizes they would like to see the data. If there is a new format that is introduced, we will consider adding that in as it gains traction and share. To start we will focus on these.
10″
How do you categorize operating systems?
With regard to operating systems, our focus is on the following.
Android iOS Windows 8/10 Windows CE/Mobile/Phone Windows Other Other
Once again this is a fluid category and as the market changes and others gain traction we will adjust.
Can I buy just one region or a few segments?
Yes, you can purchase as little as one segment in one region or the entire model with all segments worldwide including the OS and format/size information.
What Vendors are Included?
- Apple
- Datalogic
- HP
- LG
- Microsoft
- Motorola/Lenovo
- Nokia
- Oracle
- Samsung
- Zebra Technologies
- Others-Retail Hardened
- Others
For the purposes of this report we do not count units that are in labs; we only count those in pilot or in rollout.
For more information, please feel free to contact us.
PRICING
Single regions can be purchased for $6,000 one time or $8,000 with quarterly updates.
Licenses Available
Enterprise License – a license that allows for the research to be accessed and shared internally with anyone else within the organization and wholly owned subsidiaries.
IHL Group License and Fair Use Agreement
All of IHL Group’s generally available research are electronic licenses and can be shared freely within the purchasing organization and wholly owned subsidiaries. We only ask that this information not be shared with partners or others outside the purchasing company without authorization from IHL Group. The license does not extend to joint ventures or other partnerships. If the relationship is not a wholly-owned subsidiary, then both parties would need a license.
Practically, this implies the following:
- The purchasing company can use the data and research worldwide internally as long as the international organizations are wholly owned subsidiaries of the purchasing company.
- The data or any research cannot be distributed in whole or in part to partners or customers without express written approval from IHL Group.
- The purchasing company may quote components of the data (limited use) in presentations to customers such as specific charts. This is limited to percentage components, not individual unit information. Unit data cannot be shared externally without express written approval from IHL Group. All references to the data in presentations should include credit to IHL Group for the data.
- The purchasing company can reference qualitative quotes in printed material with written approval from IHL Group.
- All requests requiring written approval should be submitted to ihl(at)ihlservices.com and will be reviewed within one business day.
For any questions regarding this policy, please contact us at 1-888-IHL-6777 (North America) +1.615.591.2955 (International) or email us at ihl(at)ihlservices.com.